Facts & Figures
Students
a) Enrolment of Undergraduate Programmes 2025/26
| School | Number of Local Students | Number of Non-local Students | Total | |
|---|---|---|---|---|
| Number | % | |||
| Business | 2,609 | 878 | 3,487 | 52.6% |
| Communication | 421 | 119 | 540 | 8.1% |
| Decision Sciences | 1,318 | 169 | 1,487 | 22.4% |
| Humanities and Social Science | 835 | 168 | 1,003 | 15.1% |
| Translation and Foreign Languages | 70 | 43 | 113 | 1.7% |
| Total | 5,253 | 1,377 | 6,630 | 100% |
b) Enrolment of Postgraduate Programmes 2025/26
| School | Number of Local Students | Number of Non-local Students | Total | |
|---|---|---|---|---|
| Number | % | |||
| Business | 9 | 220 | 229 | 25.3% |
| Communication | 7 | 91 | 98 | 10.8% |
| Decision Sciences | 46 | 205 | 251 | 27.7% |
| Humanities and Social Science | 14 | 229 | 243 | 26.8% |
| Translation and Foreign Languages | 3 | 82 | 85 | 9.4% |
| Total | 79 | 827 | 906 | 100% |
c) Enrolment by Gender 2025/26
| School | Undergraduate | Postgraduate | ||||||
|---|---|---|---|---|---|---|---|---|
| Female | % | Male | % | Female | % | Male | % | |
| Business | 1,787 | 27% | 1,700 | 25.6% | 127 | 14.0% | 102 | 11.3% |
| Communication | 354 | 5.3% | 186 | 2.8% | 81 | 8.9% | 17 | 1.9% |
| Decision Sciences | 550 | 8.3% | 937 | 14.3% | 92 | 10.2% | 159 | 17.5% |
| Humanities and Social Science | 635 | 9.6% | 368 | 5.6% | 192 | 21.2% | 51 | 5.6% |
| Translation and Foreign Languages | 82 | 1.2% | 31 | 0.5% | 73 | 8.1% | 12 | 1.3% |
| Total | 3,408 | 51.4% | 3,222 | 48.6% | 565 | 62% | 341 | 38% |
d) Admission 2025/26
| Undergraduate | Postgraduate | |||||
|---|---|---|---|---|---|---|
| Year 1 | % | Upper Years | % | Number | % | |
| Business | 722 | 31.2% | 530 | 22.9% | 233 | 23.6% |
| Communication | 99 | 4.3% | 85 | 3.7% | 101 | 10.2% |
| Decision Sciences | 411 | 17.8% | 102 | 4.4% | 232 | 23.5% |
| Humanities and Social Science | 185 | 8% | 143 | 6.2% | 342 | 34.6% |
| Translation and Foreign Languages | 29 | 1.3% | 6 | 0.3% | 80 | 8.1% |
| Total | 1,446 | 62.5% | 866 | 37.5% | ||
| Total (All Years) | 2,312 | 988 | ||||
(Undergraduate student figures as of September 2025; Postgraduate student figures as of December 2025.)
Graphics Format
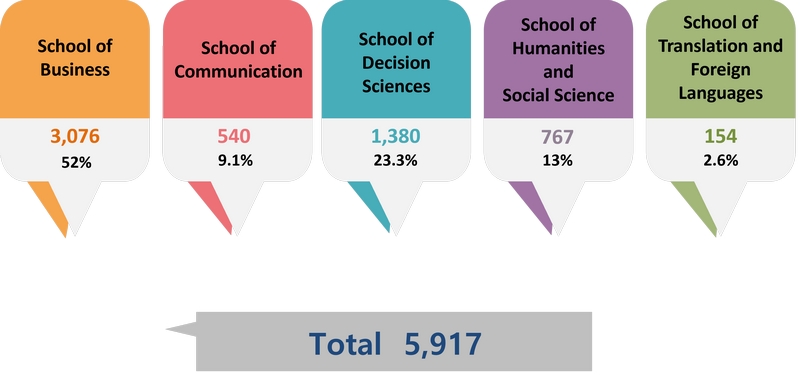
a) Enrolment 2022/23 (Undergraduate)

Enrolment 2022/23 (Postgraduate)

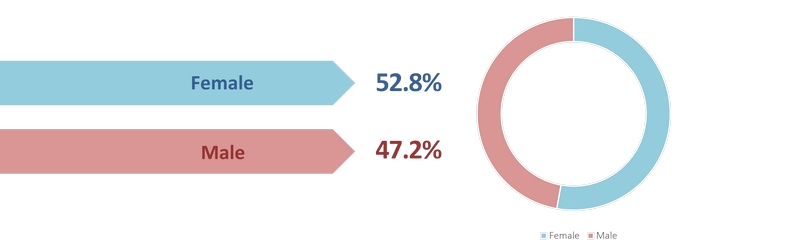
b) Enrolment by Gender 2022/23 (Undergraduate)

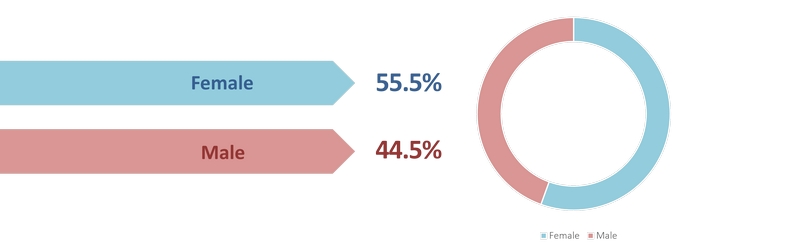
Enrolment by Gender 2022/23 (Postgraduate)

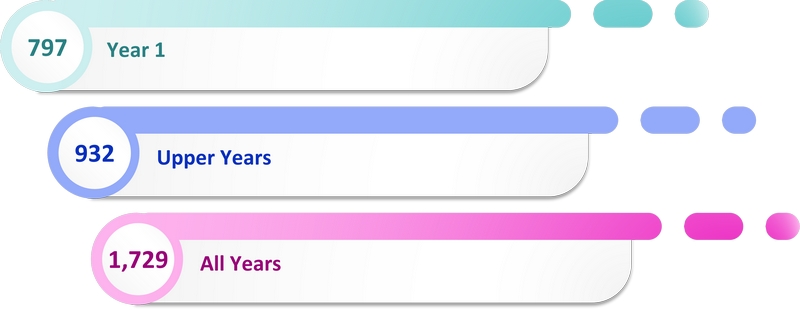
c) Admission 2022/23 (Undergraduate)

Admission 2022/23 (Postgraduate)

d) Student Residence and Number of Places
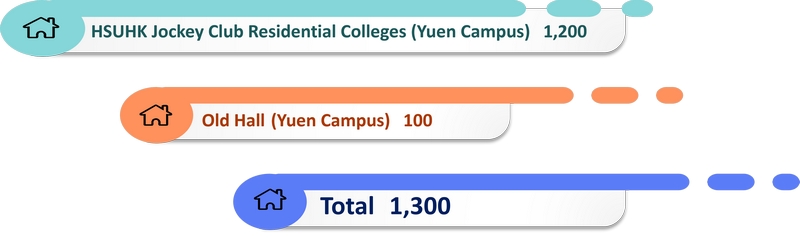
Table Format
a) Enrolment 2022/23
| School | Undergraduate | Postgraduate | ||
|---|---|---|---|---|
| Number | % | Number | % | |
| Business | 3,076 | 52% | 224 | 43% |
| Communication | 540 | 9.1% | 45 | 8.6% |
| Decision Sciences | 1,380 | 23.3% | 106 | 20.3% |
| Humanities and Social Science | 767 | 13% | 106 | 20.3% |
| Translation and Foreign Languages | 154 | 2.6% | 40 | 7.7% |
| Total | 5,917 | 100% | 521 | 100% |
b) Enrolment by Gender 2022/23
| Undergraduate | Postgraduate | |||
|---|---|---|---|---|
| Number | % | Number | % | |
| Female | 3,125 | 52.8% | 289 | 55.5% |
| Male | 2,792 | 47.2% | 232 | 44.5% |
c) Admission 2022/23
| Undergraduate | Postgraduate | |||
|---|---|---|---|---|
| Number | % | Number | % | |
| Year 1 | 797 | 46.1% | – | – |
| Upper Years | 932 | 53.9% | – | – |
| All Years | 1,729 | 100% | 394 | 100% |
(Student figures as of September 2022)
d) Student Residence
| Student Residence | Number of Places |
|---|---|
| HSUHK Jockey Club Residential Colleges (Yuen Campus) | 1,200 |
| Old Hall (Yuen Campus) | 100 |
| Total | 1,300 |
