Staff
Graphics Format
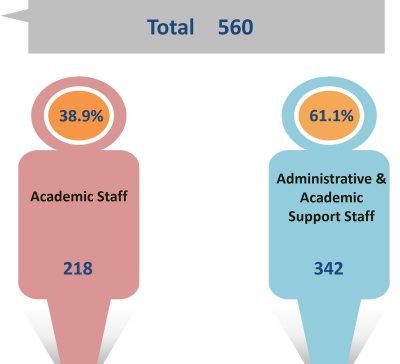
a) Category and Number of Staff 2022/23
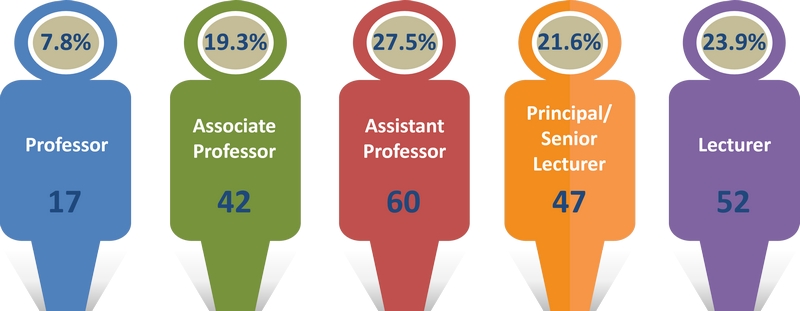
b) Category and Number of Academic Staff 2022/23
c) Professorial Staff Possessing Doctoral Degree (Assistant Professor and above)
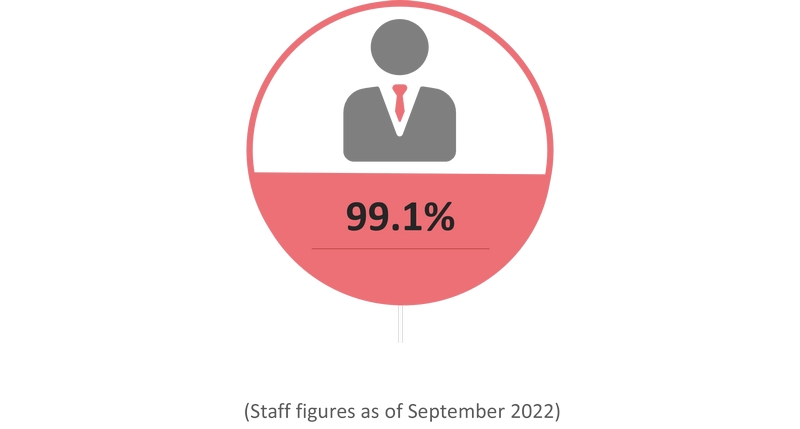
Table Format
a) Category and Number of Staff 2022/23
| Category of Staff | Number | % |
|---|---|---|
| Academic Staff | 218 | 38.9% |
| Administrative and Academic Support Staff | 342 | 61.1% |
| Total | 560 | 100% |
b) Category and Number of Academic Staff 2022/23
| Category of Staff | Number | % |
|---|---|---|
| Professor | 17 | 7.8% |
| Associate Professor | 42 | 19.3% |
| Assistant Professor | 60 | 27.5% |
| Principal/Senior Lecturer | 47 | 21.6% |
| Lecturer | 52 | 23.9% |
| Total | 218 | 100% |
c) Professorial Staff Profile (Assistant Professor and above) 2022/23
| Professorial Staff Possessing Doctoral Degree | 99.1% |
(Staff figures as of September 2022)