Graduates
Graphics Format
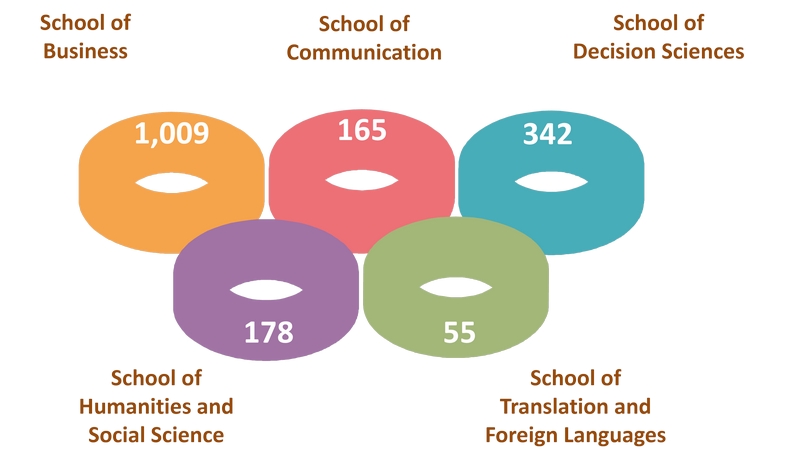
a) Number of Graduates of Undergraduate Class 2021
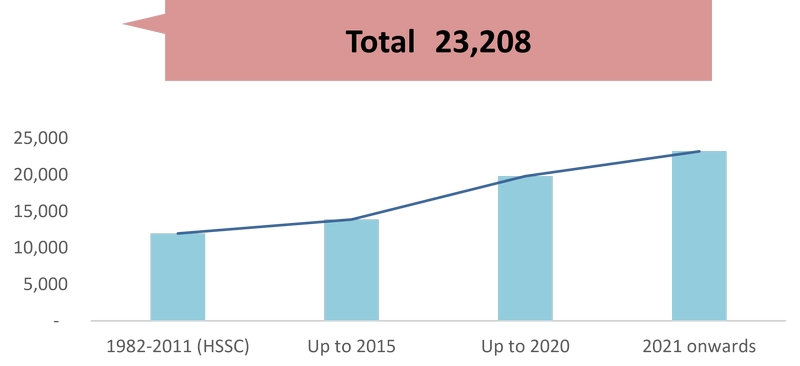
b) Total Number of Graduates
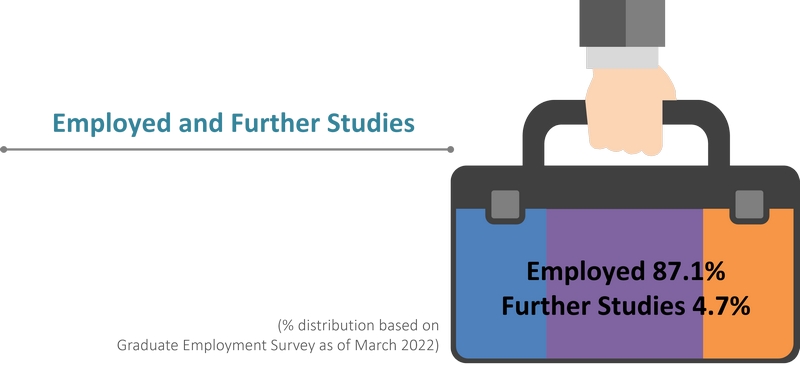
c) Graduate Employment of Class 2021
d) Employment Industries of Full-time Employed Graduates of Undergraduate Class 2021
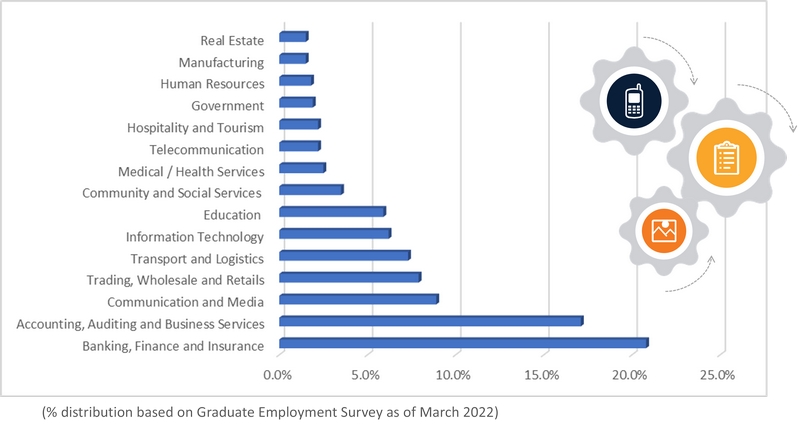
Table Format
a) Number of Graduates of Undergraduate Class 2021
| School | Number |
|---|---|
| Business | 1,009 |
| Communication | 165 |
| Decision Sciences | 342 |
| Humanities and Social Science | 178 |
| Translation and Foreign Languages | 55 |
| Total | 1,749 |
b) Total Number of Graduates: 23,208
| Year | Number |
|---|---|
| 1982-2011 (HSSC) | 11,952 |
| Up to 2015 | 13,868 |
| Up to 2020 | 19,817 |
| 2021 onwards | 23,208 |
c) Graduate Employment of Undergraduate Class 2021
| Employed | 87.1% |
| Further Studies | 4.7% |
(% distribution based on Graduate Employment Survey as of March 2022)
d) Employment Industries of Full-time Employed Graduates of Undergraduate Class 2021
| Employment Industries | % |
|---|---|
| Banking, Finance and Insurance | 20.8% |
| Accounting, Auditing and Business Services | 17.1% |
| Communication and Media | 8.9% |
| Trading, Wholesale and Retails | 7.9% |
| Transport and Logistics | 7.3% |
| Information Technology | 6.2% |
| Education | 5.9% |
| Community and Social Services | 3.5% |
| Medical / Health Services | 2.5% |
| Telecommunication | 2.2% |
| Hospitality and Tourism | 2.2% |
| Government | 1.9% |
| Human Resources | 1.8% |
| Manufacturing | 1.5% |
| Real Estate | 1.5% |
(% distribution based on Graduate Employment Survey as of March 2022)